
Microsoft Power BI
Gain insights into your business
Microsoft Power BI is a powerful business intelligence tool that can strengthen your business.
By analyzing and visualizing data with Power BI, you are presented with your business data as reports and dashboards, giving you an overview of your business’s strengths and weaknesses.
Power BI enables you to share up-to-date data with your team or key individuals within the organization.
Based on reporting, data can be used strategically, allowing you to make decisions based on data.
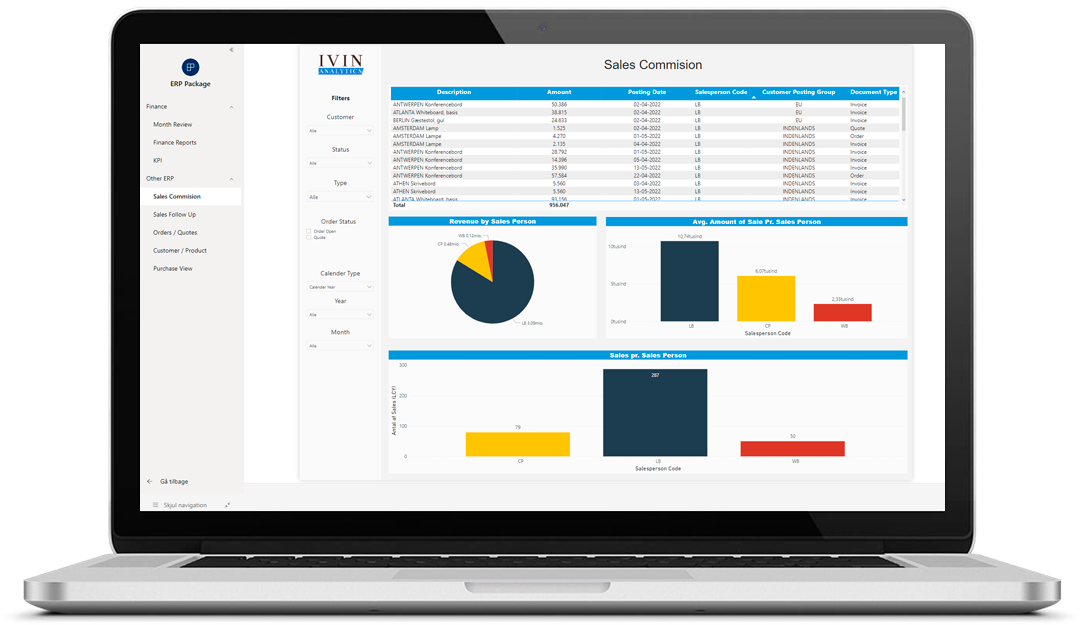
Get a visual overview
Reporting and visual dashboards in Power BI provide you with better insights into different business areas, allowing you to make leadership decisions based on a broader knowledge base.
Examples of reporting and dashboards:
- Finance
- Sales
- E-commerce
Get more out of your data with Business Intelligence
By analyzing data and identifying patterns, trends, and insights, you get detailed reporting that provides a strong foundation for making important and strategic decisions for your business.
Business Intelligence gives you insights into your own operations and can be used for various purposes, such as improving customer satisfaction, increasing sales, reducing costs, optimizing processes, or identifying new opportunities.
Where does the data come from?
To get an overview of your business, it is obvious to start with reporting based on data from your financial system.
Other options could include data from the following systems:
- CRM
- Webshop
- Time tracking
- HR
- Outlook
A combination of data across relevant systems in your business can provide you with a comprehensive overview and open up many new opportunities.
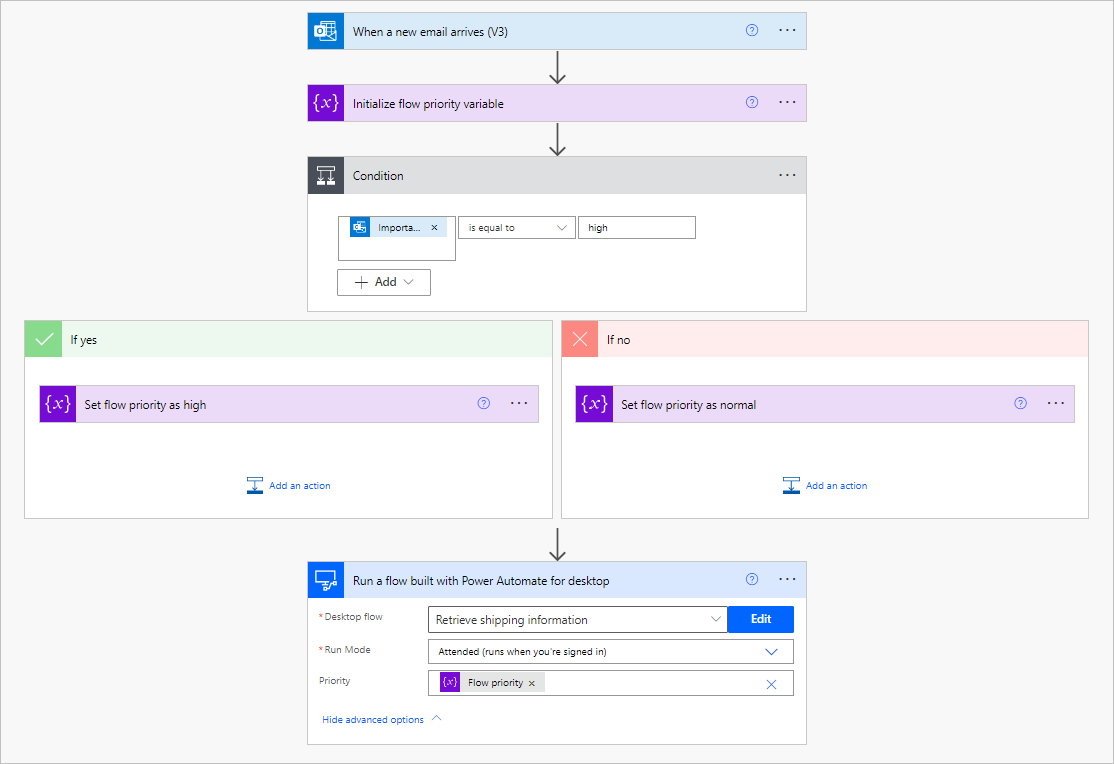
Take your Power BI reporting to the next level
By triggering an automated flow based on the data in your reports, you can act on exactly what your data shows. This allows for tailored solutions that fit your specific needs.
Examples:
- E-commerce
Automatic email notification based on the number of visitors or purchases in your webshop. - Time tracking
Automatic email notification for missing time entries.
Make decisions based on data
Data analysis is a powerful tool that can be used to improve your business in many ways. By analyzing your data, you can gain valuable insights, make better decisions, and optimize your processes.
We perform these three types of analysis:
- Descriptive analysis
- Predictive analysis
- Prescriptive analysis
Get started easily
We have predefined a set of dashboards so you can get started with Power BI quickly and easily.


Want to know more?
Henrik Munch Carlsen
Sales Manager
+45 21 84 86 21
hmc@consit.dk